Your AUSTIN Real Estate Market Report | November 2024
The Oldham Group brings you Austin news, exciting events, homes for sales and uniquely fun things happening around greater Austin. Feel free to contact us at anytime to be added to our distribution list.

Oldham Group Austin Update
Your November 2024 Market Report
December 9, 2024

Your November 2024 Market Report
As 2024 comes to a close, I’m excited to share the latest Austin Market Report, featuring key market insights from November’s activity and statistics.

November saw a neutral market. Not hot, not cold – just steady.
Click below to view the full November Market Report.
Here’s What You Need to Know
Market Mood
November experienced a rise in sales activity, with closed sales increasing by 8% and new contracts surging by over 27% compared to last year, pointing towards heightened buyer confidence. Closed prices stayed largely consistent, while there was a slight decrease in new inventory.
Homes on Deck
Total listings dipped 3 %, bringing the count to 2,603.
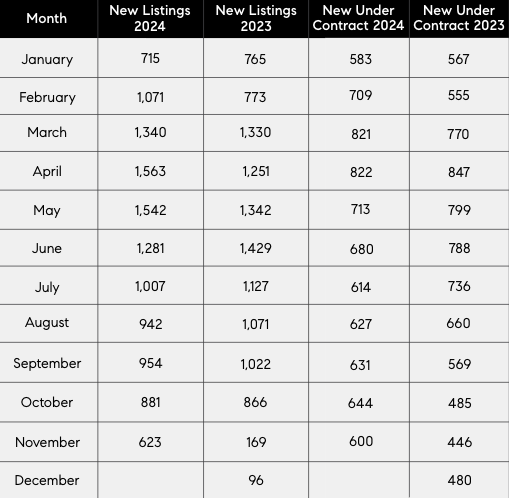
November added 622 new listings to the market, a -13% decrease from last year.
4.5 Months of Inventory
There’s a balance – not a clear edge for buyers or sellers.
Sales Pulse
542 homes sold in November, a slight decrease from last month,
but a slight increase year-over-year of 10%.
Buyer activity was up significantly, with 600 new contracts, a 27% increase from last year.
Price Tag Trends
Average Sales Price is up 3% to $809,671
New Contracts Written: 600, up 27%
Median List Price U/C = $640,000
Average List Price U/C = $864,181
Average List Price: From $159,900 to $8,950,000
Median List Price = $649,950
Average List Price = $1,152,631
Buyer and Seller Clues
Homes took an average of 73 days to sell, stretching out by 7.35% compared to last month.
The Average Sold Price to Original List Price Ratio is a steady 92%.
Sellers are negotiating but have held firm at 90% to 92% for the last three months.
All in all, we’re in a balanced spot. The numbers speak to normal seasonal trends, with a little more buyer activity than last year., keeping the market cruising without too much sway in either direction.
Stability Amid Market Adjustments
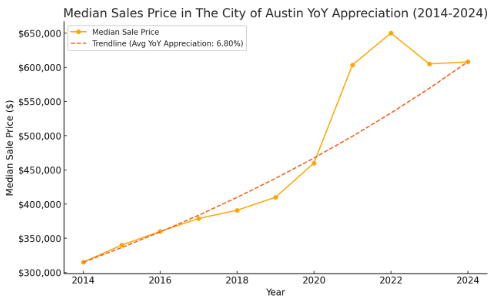
The Austin real estate market continues to hold steady, with YTD median sales prices showing less than 1% movement from 2023.
While the market experienced high swings between 2020 and 2022, followed by adjustments in 2023 and 2024, the long-term outlook remains strong.
On average, Austin real estate has delivered an impressive annual appreciation rate of nearly 7%.
Average Days on Market Sold Price to Original List Price %
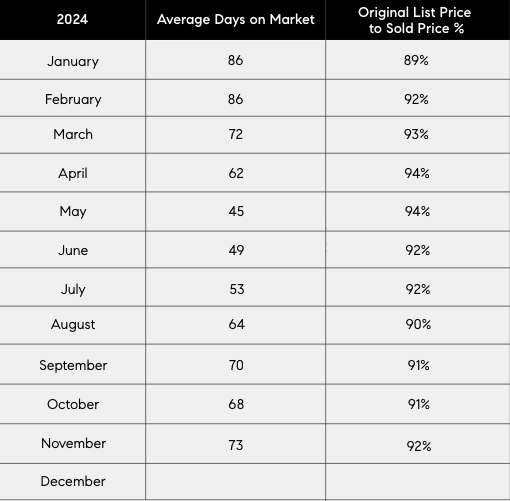
The Average DOM shows the number of days a property was on the market before it sold.
An upward trend in DOM indicates a move toward a Buyer’s market.
The Sold Price vs. Original List Price reveals the percentage of the Original List Price properties sold for.
Monthly Supply of Inventory
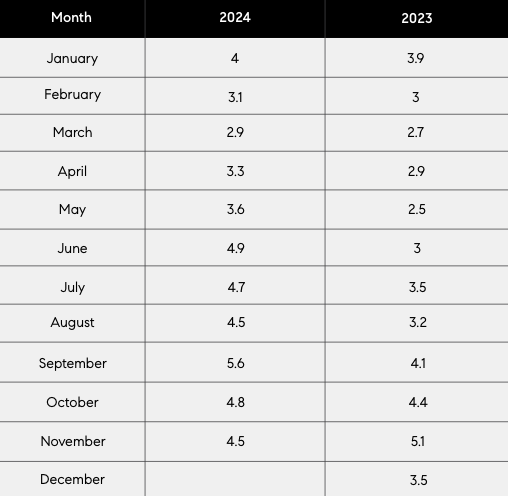
Real estate economists tell us a six-month supply of For Sale Inventory represents a balanced market between sellers and buyers.
Over six months of For Sale inventory indicates a Buyer’s market. Less than six months of inventory indicates a Seller’s market.
New Listing Taken | New Under Contracts
Inventory Snapshot
Active Listings = 2,603
Median List Price = $649,000
Average List Price = $1,003,315
From $155,900 to $8,950,000
New Under Contracts Snapshot
New Under Contracts Written = 600
Median List Price UCW = $640,000
Average List Price UCW = $864,181
From $229,900 to $5,494,000
1 Brokerage in Austin
#1
Brokerage by Total Sales in
Units Across the State of Texas
#1
Brokerage by Total Sales in
Volume Across the State of Texas
#1
Brokerage by Total Sales
in Volume in the City of Austin
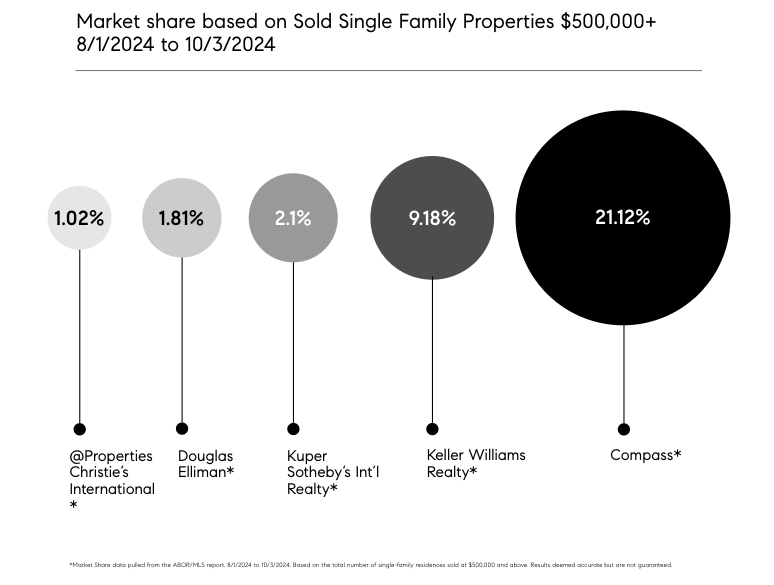
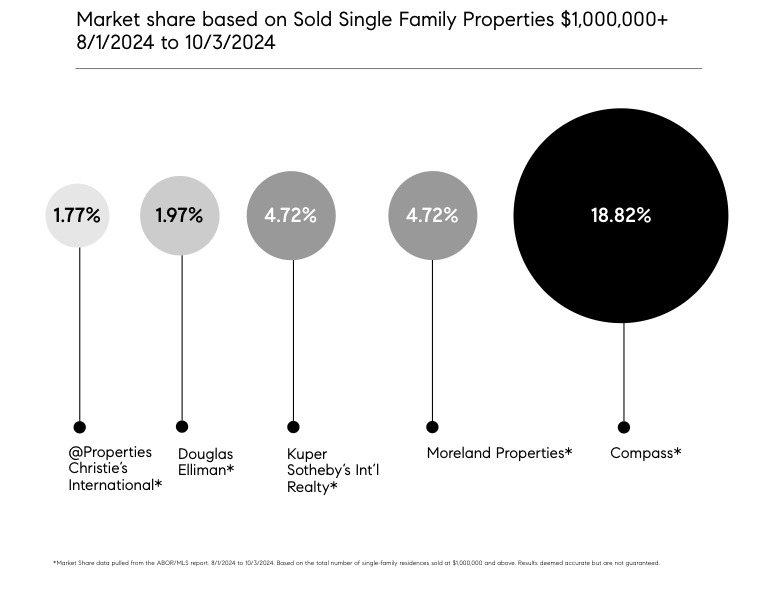
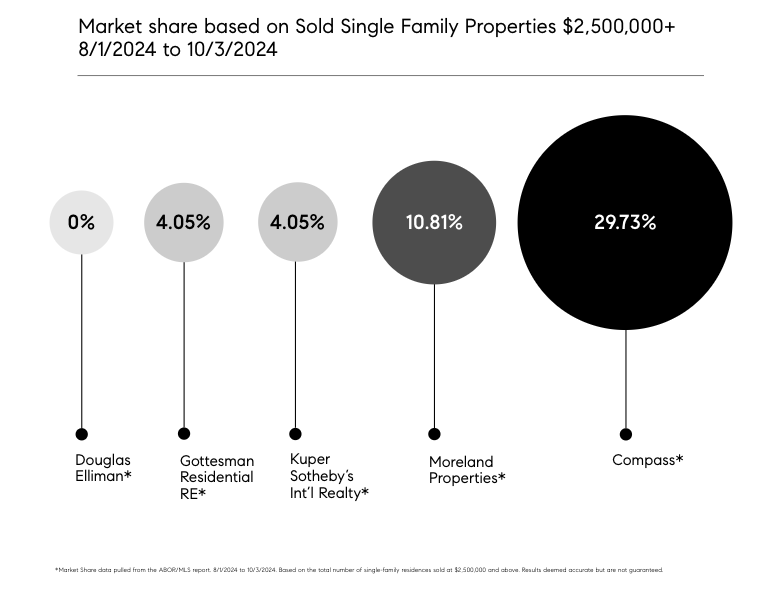
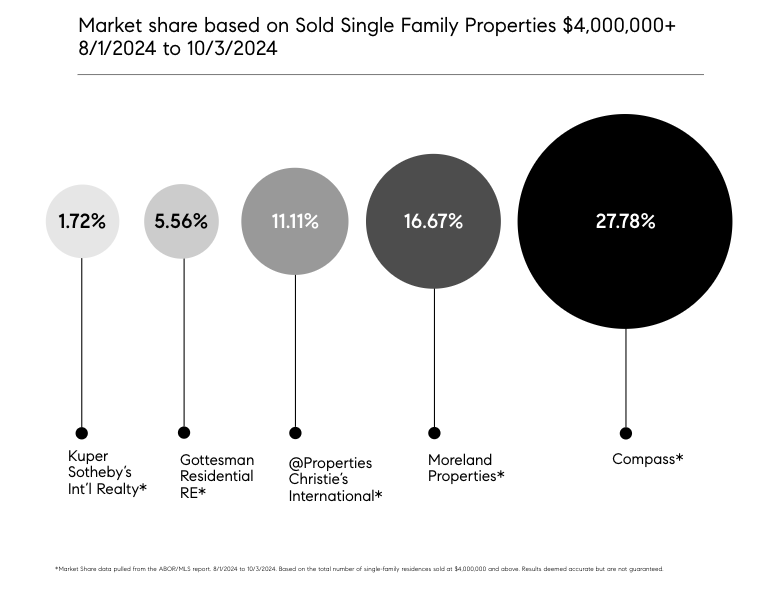
#1
Luxury Brokerage in the City
of Austin in Home Sales over $1M
$4.7B
Total Sales Volume Year-To-Date
1/1/2024 – 10/3/2024
9,320
Total Transactions Year-To-Date
1/1/2024 – 10/3/2024
1,376
Principal Agents and Team Members
1 Brokerage in Austin
Start Your Planning Today!
It’s the perfect time to start planning your 2025 real estate strategy.
Let’s connect and put your plan in place.

Courtney Oldham
© Compass 2025 | All Rights Reserved by Compass | Made in NYC
The information contained herein does not purport to be complete nor, necessarily, accurate and should be independently verified; nor does it represent or constitute a legal analysis or financial advice. All of the financial projections and/or conclusions are provided for illustration purposes only. Compass and its agents disclaim any and all liability for representations and warranties, express or implied, contained in, or for omissions from, the information contained herein or any other written or oral communication transmitted or made available to the recipient. This represents an estimated sale price for this property. It is not the same as an opinion of value in an appraisal developed by a licensed appraiser under the Uniform Standards of Professional Appraisal Practice.